> ## Documentation Index
> Fetch the complete documentation index at: https://trybloom.co.uk/docs/llms.txt
> Use this file to discover all available pages before exploring further.
# Insights
> A calm summary of your practice - sessions delivered, income received, and practice health.
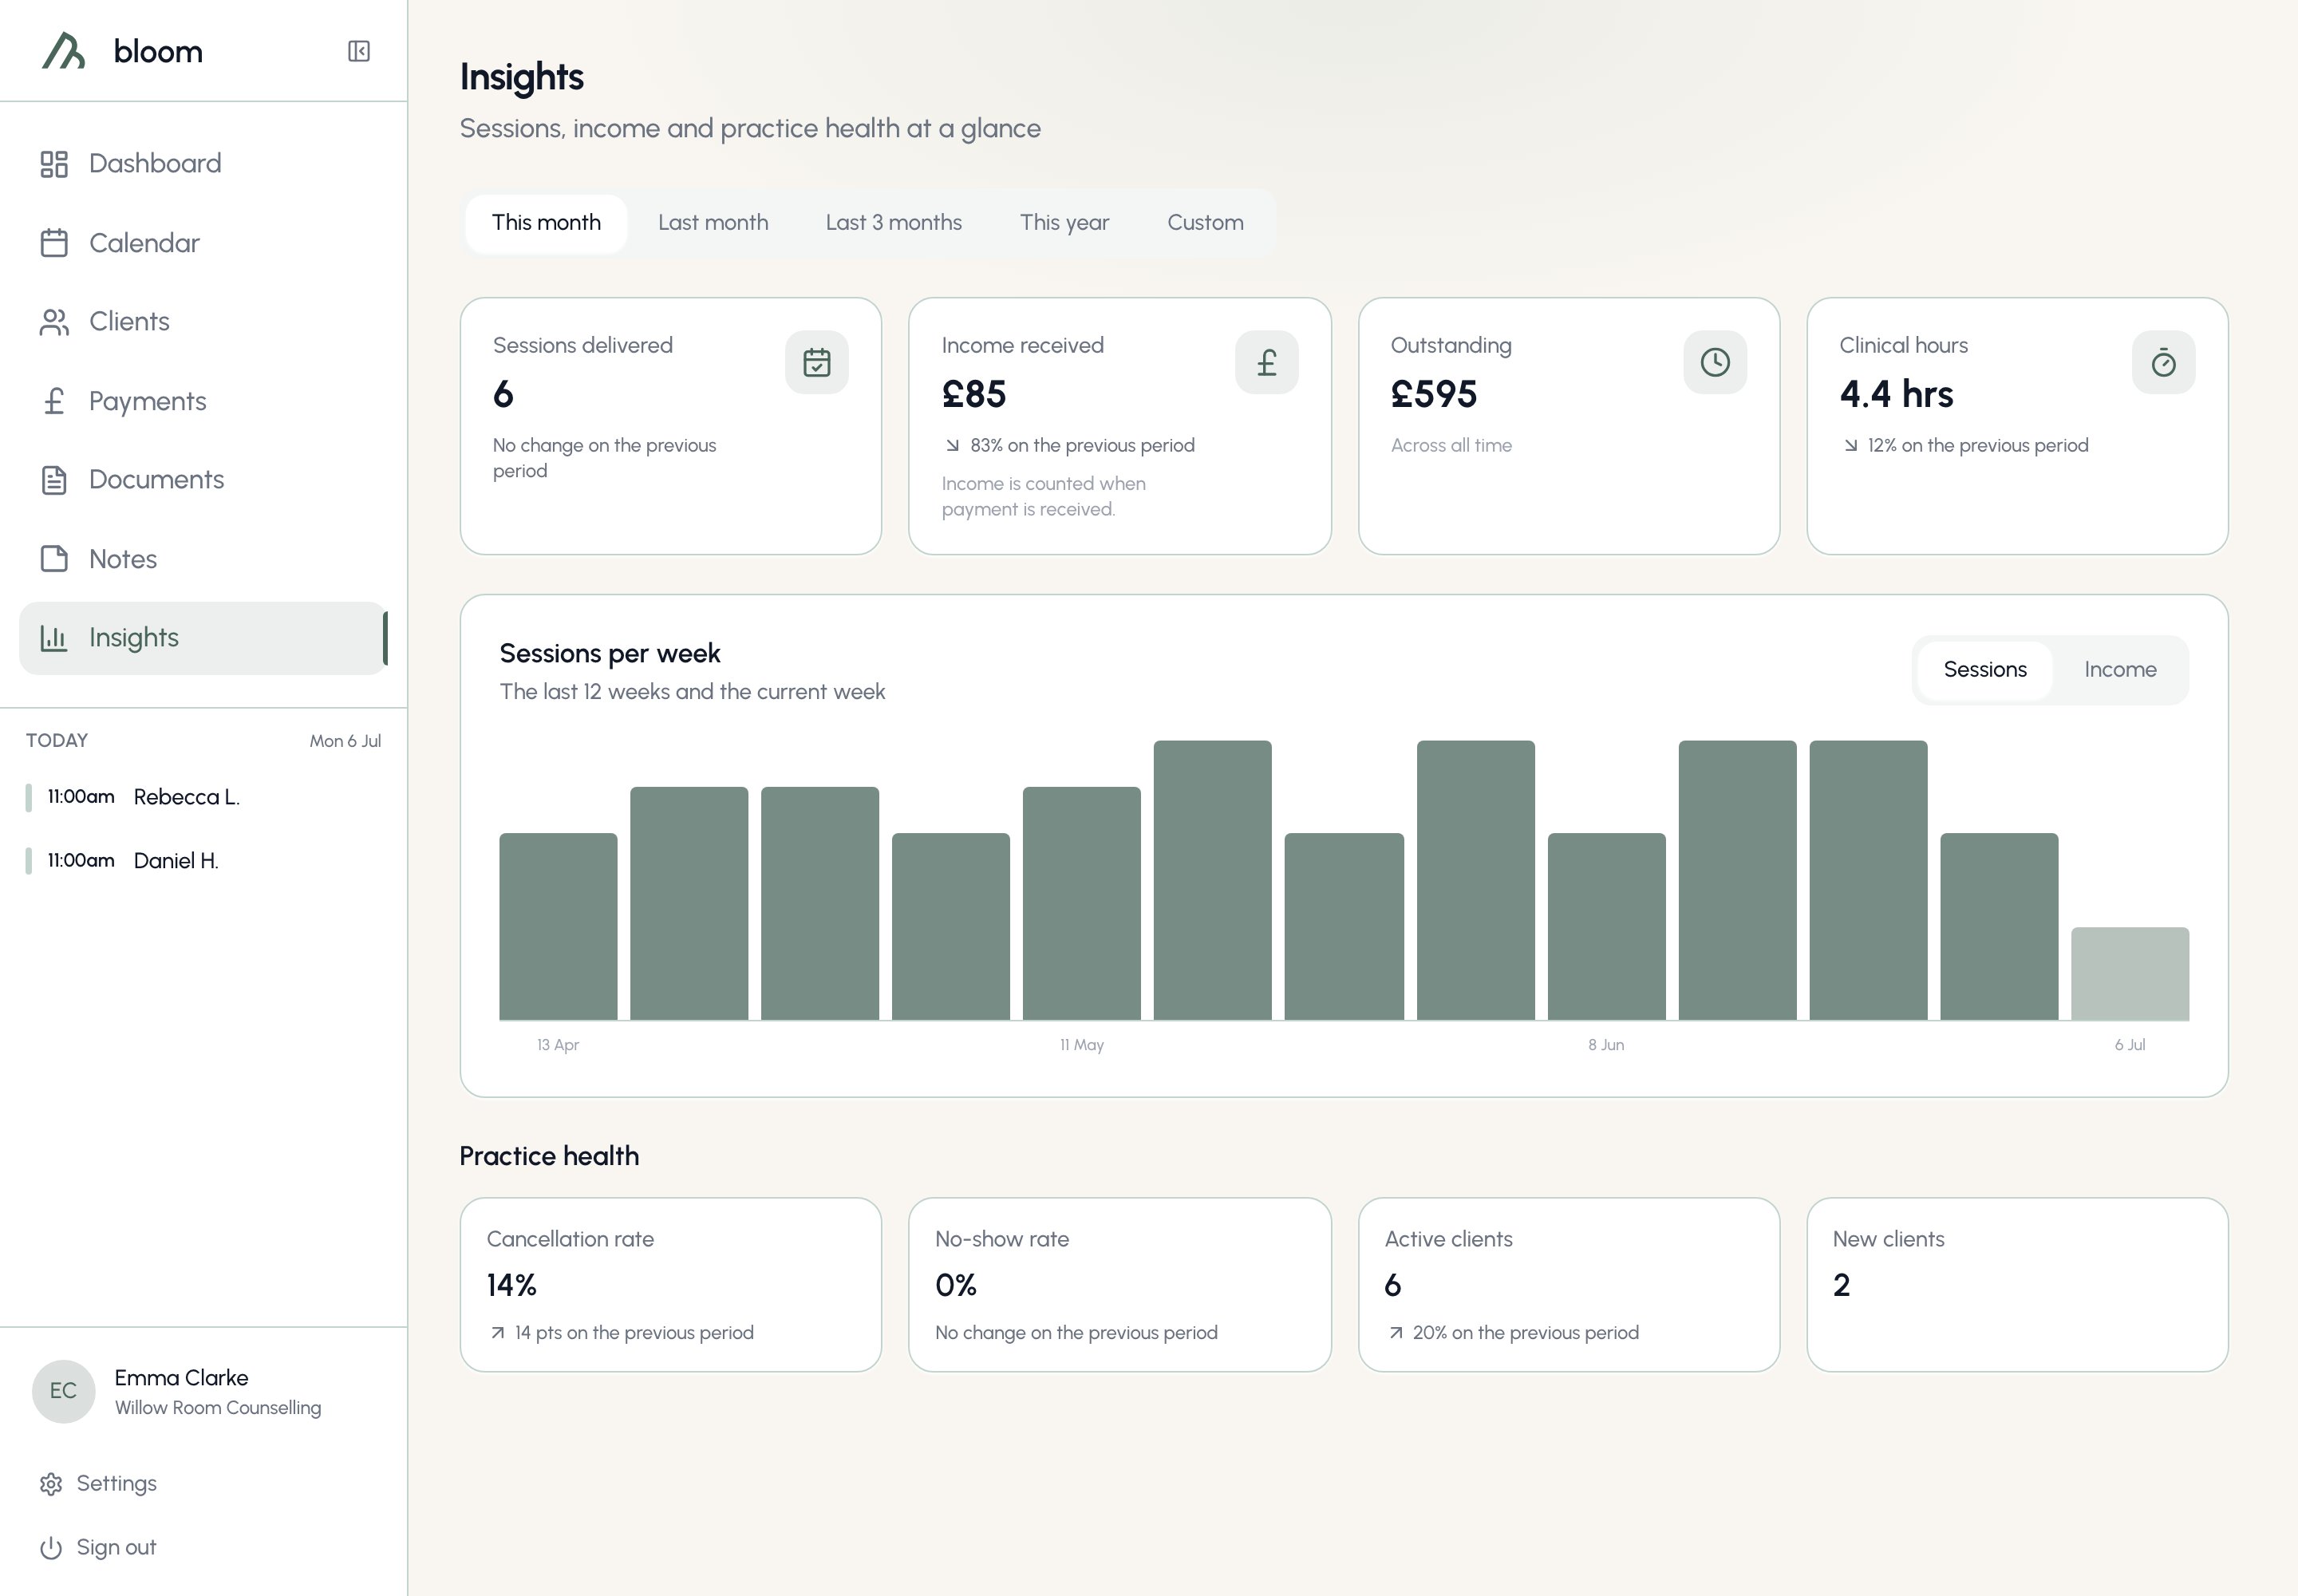
Insights is your clear view of your own practice: how many sessions you've delivered, what you've earned, what's still owed, and a small set of practice health indicators. You'll find it in the sidebar under **Insights**.
The page is designed to read like a calm monthly summary from a good bookkeeper - no targets, no warning colours, just your numbers as they are.
 Insights is entirely read-only - nothing on this page changes your data. It also stays available if your subscription ever lapses, so your numbers are never locked away.
## Choosing a period
Five options sit at the top of the page, and everything except the weekly chart follows the one you pick:
* **This month** - the 1st to today. This is where the page opens.
* **Last month** - the full previous calendar month.
* **Last 3 months** - the month you're in plus the two before it, the way you'd say it out loud.
* **This year** - 1 January to today.
* **Custom** - any start and end date you like, up to two years apart. The end date can't be in the future.
Insights is entirely read-only - nothing on this page changes your data. It also stays available if your subscription ever lapses, so your numbers are never locked away.
## Choosing a period
Five options sit at the top of the page, and everything except the weekly chart follows the one you pick:
* **This month** - the 1st to today. This is where the page opens.
* **Last month** - the full previous calendar month.
* **Last 3 months** - the month you're in plus the two before it, the way you'd say it out loud.
* **This year** - 1 January to today.
* **Custom** - any start and end date you like, up to two years apart. The end date can't be in the future.
 ## The headline cards
 * **Sessions delivered** - completed sessions in the period, including free consultations; they're real contact time. Cancellations and no-shows don't count, even when a cancellation fee applies, so the number stays honest for your accreditation log.
* **Income received** - payments added up by the date you received them, not the session date. A June session paid in July counts as July income, so the figure always matches your bank statement - the way most UK sole traders do their books. Voided payments don't count.
* **Outstanding** - everything currently owed, across all time. It ignores the period selector, and it's exactly the same figure as the Payments page - the two will never disagree.
* **Clinical hours** - the total delivered time of the same sessions counted in Sessions delivered.
Keeping an accreditation log for BACP, UKCP, or similar? Select **This year** and Clinical hours gives you your running total for the year.
A confirmed session counts automatically once it's over - there's nothing to tick off after each appointment. The exception is a no-show, which you mark from the calendar.
### Comparison lines
Beneath most figures you'll see a quiet grey line comparing the period against the one before it:
* **This month** compares against the same stretch of last month - the 1st to the same day - so you're never comparing six days against thirty-one.
* **Last month** compares against the month before it.
* **Last 3 months** compares against the three months preceding them.
* **This year** compares against the same stretch of last year.
If the previous period has nothing to compare against, the line simply doesn't appear. Custom ranges never show comparisons.
Comparisons are deliberately neutral - no red for a down month, no green for an up one. A quiet month is information, not failure.
## Sessions per week
The chart shows your sessions per week across the last 12 full weeks plus the current one, whatever period you've selected above it - it's a fixed lens on your recent rhythm. Weeks run Monday to Sunday, and the current week appears in a lighter shade because it's still filling in.
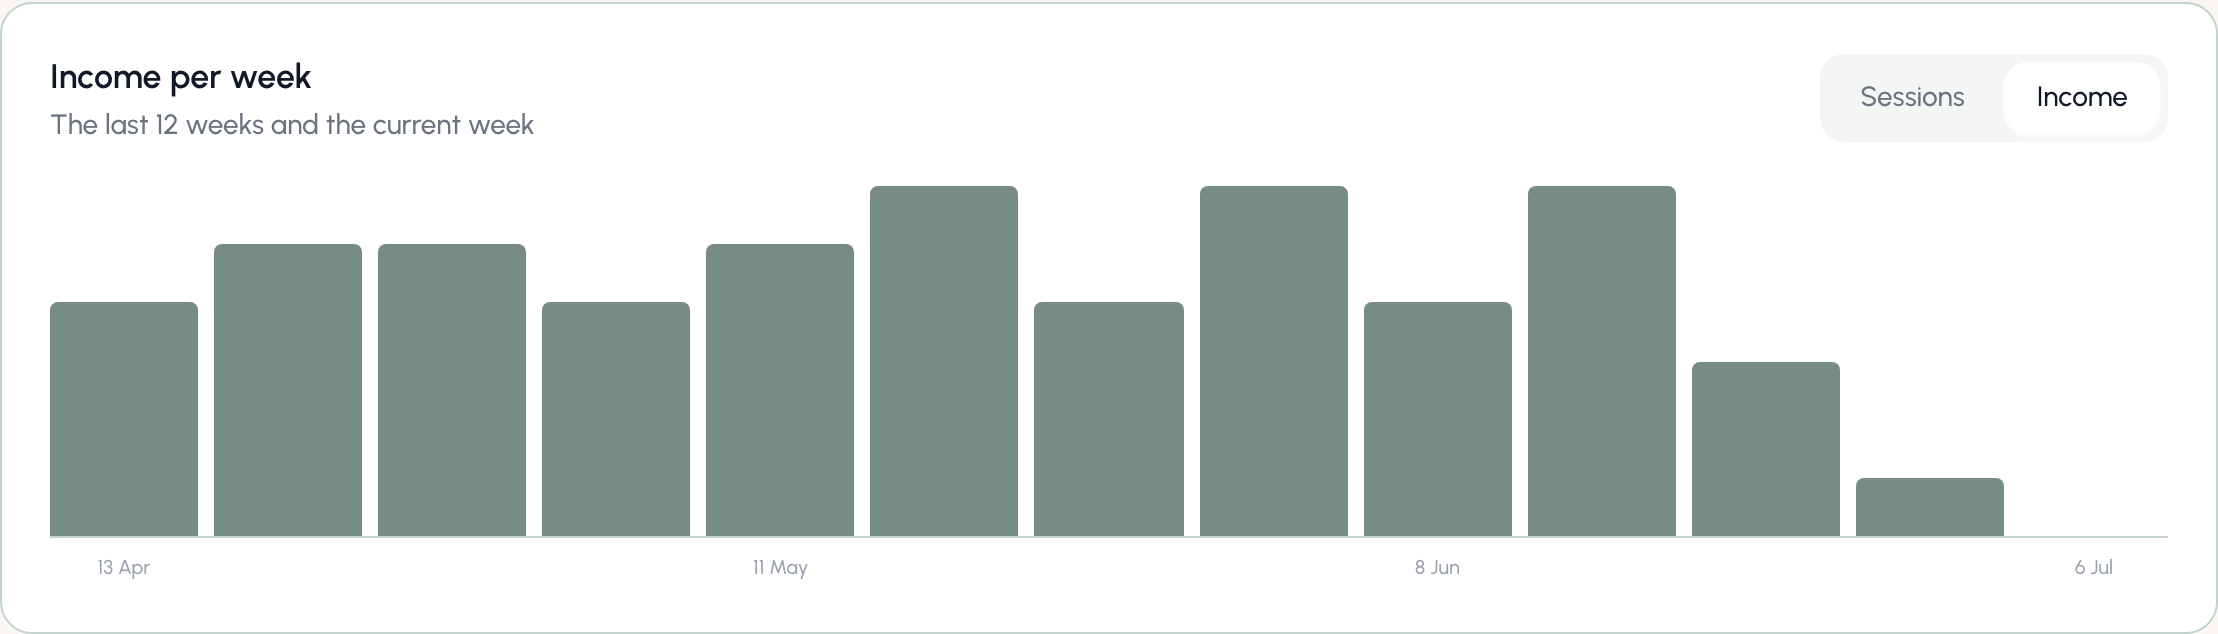
Use the toggle to switch the same weeks to **Income**, showing what you received in each.
* **Sessions delivered** - completed sessions in the period, including free consultations; they're real contact time. Cancellations and no-shows don't count, even when a cancellation fee applies, so the number stays honest for your accreditation log.
* **Income received** - payments added up by the date you received them, not the session date. A June session paid in July counts as July income, so the figure always matches your bank statement - the way most UK sole traders do their books. Voided payments don't count.
* **Outstanding** - everything currently owed, across all time. It ignores the period selector, and it's exactly the same figure as the Payments page - the two will never disagree.
* **Clinical hours** - the total delivered time of the same sessions counted in Sessions delivered.
Keeping an accreditation log for BACP, UKCP, or similar? Select **This year** and Clinical hours gives you your running total for the year.
A confirmed session counts automatically once it's over - there's nothing to tick off after each appointment. The exception is a no-show, which you mark from the calendar.
### Comparison lines
Beneath most figures you'll see a quiet grey line comparing the period against the one before it:
* **This month** compares against the same stretch of last month - the 1st to the same day - so you're never comparing six days against thirty-one.
* **Last month** compares against the month before it.
* **Last 3 months** compares against the three months preceding them.
* **This year** compares against the same stretch of last year.
If the previous period has nothing to compare against, the line simply doesn't appear. Custom ranges never show comparisons.
Comparisons are deliberately neutral - no red for a down month, no green for an up one. A quiet month is information, not failure.
## Sessions per week
The chart shows your sessions per week across the last 12 full weeks plus the current one, whatever period you've selected above it - it's a fixed lens on your recent rhythm. Weeks run Monday to Sunday, and the current week appears in a lighter shade because it's still filling in.
Use the toggle to switch the same weeks to **Income**, showing what you received in each.
 ## Practice health
Four smaller figures sit below the chart, all following your selected period:
* **Cancellation rate** - cancelled sessions as a share of everything that was due to happen: completed, cancelled, and no-shows together. Sessions still ahead of you in the diary aren't counted; the rate describes what happened, not what's scheduled.
* **No-show rate** - the same calculation, for no-shows.
* **Active clients** - clients with at least one session in the period. A client whose only appointment was a cancellation isn't counted, and archived clients never are.
* **New clients** - clients you added to Bloom during the period, whatever their status today.
If a period contains no sessions at all, the rates show a dash rather than 0% - no sessions isn't the same as no cancellations.
## Practices with more than one therapist
In a practice with more than one member, the practice owner sees an extra selector at the top of the page: **All**, or any individual therapist by name. **All** combines everyone's numbers; choosing a name scopes every figure on the page - cards, chart, and practice health - to that therapist.
Practice members always see their own numbers, and only their own. There's no selector on their page, and no side-by-side comparison of therapists anywhere - that's a deliberate choice, not a missing feature.
## Before your first session
Insights waits for your practice to have some history. Until your first session is completed, the page shows a simple note in place of empty charts - your numbers appear from your first completed session onwards.
If you've been with Bloom a while and select a quiet period, the cards show honest zeros instead.
## Practice health
Four smaller figures sit below the chart, all following your selected period:
* **Cancellation rate** - cancelled sessions as a share of everything that was due to happen: completed, cancelled, and no-shows together. Sessions still ahead of you in the diary aren't counted; the rate describes what happened, not what's scheduled.
* **No-show rate** - the same calculation, for no-shows.
* **Active clients** - clients with at least one session in the period. A client whose only appointment was a cancellation isn't counted, and archived clients never are.
* **New clients** - clients you added to Bloom during the period, whatever their status today.
If a period contains no sessions at all, the rates show a dash rather than 0% - no sessions isn't the same as no cancellations.
## Practices with more than one therapist
In a practice with more than one member, the practice owner sees an extra selector at the top of the page: **All**, or any individual therapist by name. **All** combines everyone's numbers; choosing a name scopes every figure on the page - cards, chart, and practice health - to that therapist.
Practice members always see their own numbers, and only their own. There's no selector on their page, and no side-by-side comparison of therapists anywhere - that's a deliberate choice, not a missing feature.
## Before your first session
Insights waits for your practice to have some history. Until your first session is completed, the page shows a simple note in place of empty charts - your numbers appear from your first completed session onwards.
If you've been with Bloom a while and select a quiet period, the cards show honest zeros instead.